Foreign direct investment (FDI) is the value of investment made by a person or a business in a business in another country other than their own country. The investment is made generally “to acquire lasting interest in or effective control over an enterprise operating outside of the economy of the investor.”
FDI is of two types. There is the FDI Net Inflows and there is also the FDI Net Outflows.
FDI Net Inflows
FDI Net Inflows include investments made directly in an economy by non-resident investors in the form of the following:
Reinvested earnings
Intra-company loans
Loan repayments
Dividends
Interest on debts
FDI Net Outflows
FDI Net Outflows is “the value of outward direct investment made by residents of the reporting economy” in the economy of another country. Just as in the case of FDI Net Inflows, FDI Net Outflows could be in the form of:
Reinvested earnings
Dividends
Inter-company loans
Loan repayments
Interest on debts
Benefits of FDI to the receiving economyManufacturing factorySome of the benefits of FDI to the receiving economy may be recounted as follows:
Makes funds available for business expansion.
Makes funds available for increased production leading to increased national revenue.
Increases employment opportunities in the receiving country.
Facilitates transfer of technology to the receiving country.
Leads to improvement in management practices.
Helps in the faster growth of the economies of receiving countries.
Builds business relationships between investors and firms across the world.
Benefits of FDI to the giving economy
FDI brings benefits to both the giving and the receiving economies. Investment from a giving economy brings the following benefits:
Brings capital and additional interest on loans granted back to the giving economy.
Increases the amount of funds available for business growth and expansion.
Helps the banks to grow faster and expand into international financing.
Helps to increase employment opportunities
Builds business relationships between investors and firms across the world.
FDI received in Africa compared to other world regions: 2007-2019
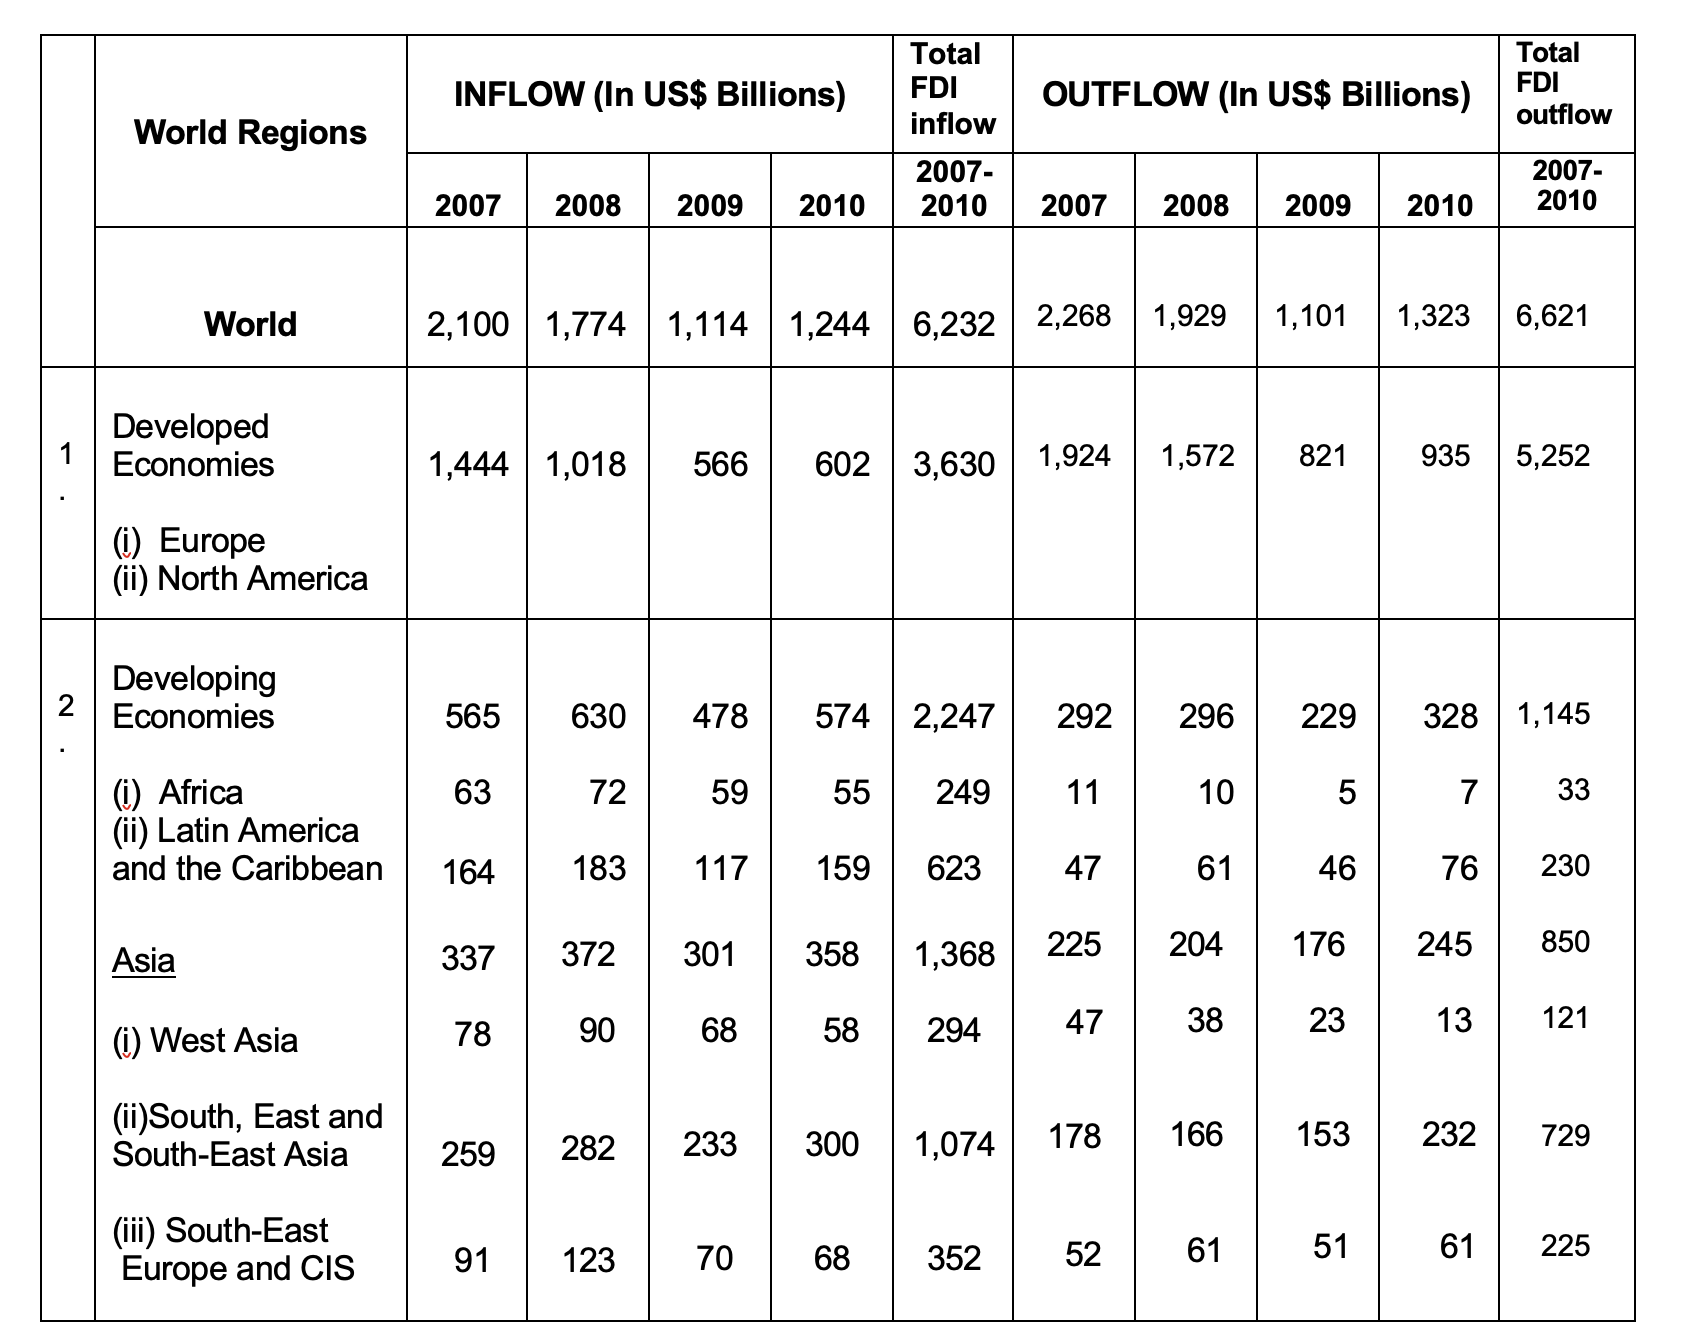
Considering the many benefits of FDI to receiving countries and regions of the world, one would be interested to know the comparative advantages of FDI to regions of the world, especially to Africa. Tables 1-3 show the amount of FDI net inflows and net outflows in world regions from 2007–2019. Pile of US DollarsTable 1:Foreign direct investment inflows and outflows in world regions from 2007-2010Table 1: Foreign direct investment inflows and outflows in world regions from 2007-2010Note
CIS in the first column, last row refers to Commonwealth of Independent States, an intergovernmental organization in Eastern Europe and Asia formed after the dissolution of the Soviet Union in 1991. These countries include Russia, Armenia, Belarus, Bosnia, Georgia, Herzegovina, Kosovo, Moldova and Ukraine,
Latin America and the Caribbean economies include economies of South and Central America: Mexico, Colombia, Brazil, Venezuela, Argentina, Puerto Rico and the Caribbean islands.
Data for 2010 is reproduced from UN data source. The rest of the data is reproduced from UNCTAD data source.
There are some disagreements, significant in only one case, between data compiled from IMF, UN and UNCTD sources. This presentation uses UNCTD data in most cases to maintain consistency.
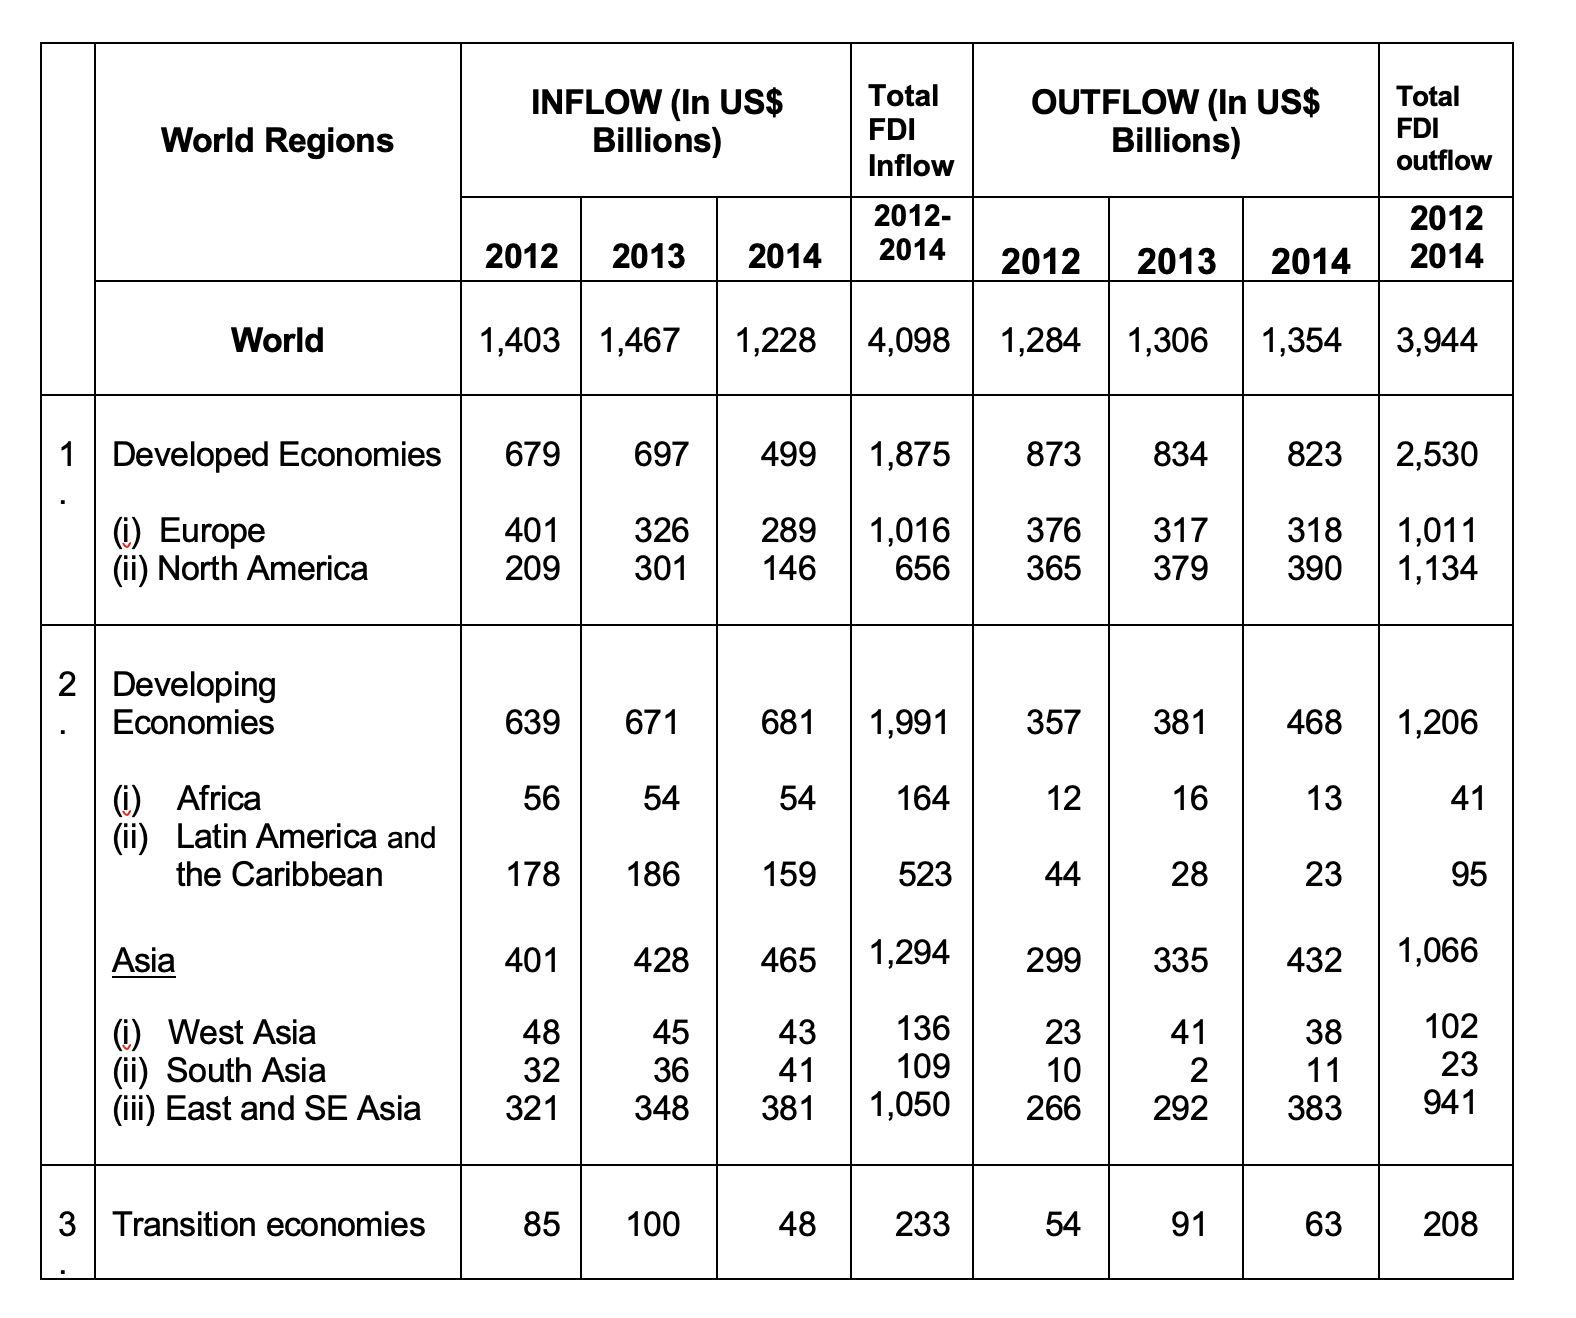
Data in Table 2 is reproduced from UNCTAD data source.
Transition economies: These include the economies referred to as the economies of Commonwealth of Independent States (CIS) already indicated in the note under Table 1. Transition economies, however, do not include all CIS economies.
Table 2 shows that Developing Economies received slightly higher FDI net inflow at 1,991 billion US dollars, just about 0.06% higher than the FDI net inflow of 1,875 billion US dollars to the Developed Economies in the period 2012-2014
2007-2010: Table 1 indicates that in the period 2007-2010, a total FDI of 3,630 billion US dollars went to the developed economies while a total of 2,247 biillion US dollars representing 62 percent of the total developed economies FDI, went to the developing economies. Of the total FDI that went to the developing economies, that is, 2,247, 11.1% went to Africa and 61% went to Asia.
2012-2014: For the period 2012-2014, Table 2 indicates a total FDI of 1,875 billion US dollars went to the developed economies, while a total of 1,991 billion US dollars representing just about 0.062 percent over the total FDI to the developed economies, went to the developing economies. Of the total FDI that went to the developing economies, that is, 1,991, 8.24% or 164 US billion dollars, went to Africa, while 65 percent, or 1,294 US billion dollars, went to Asia
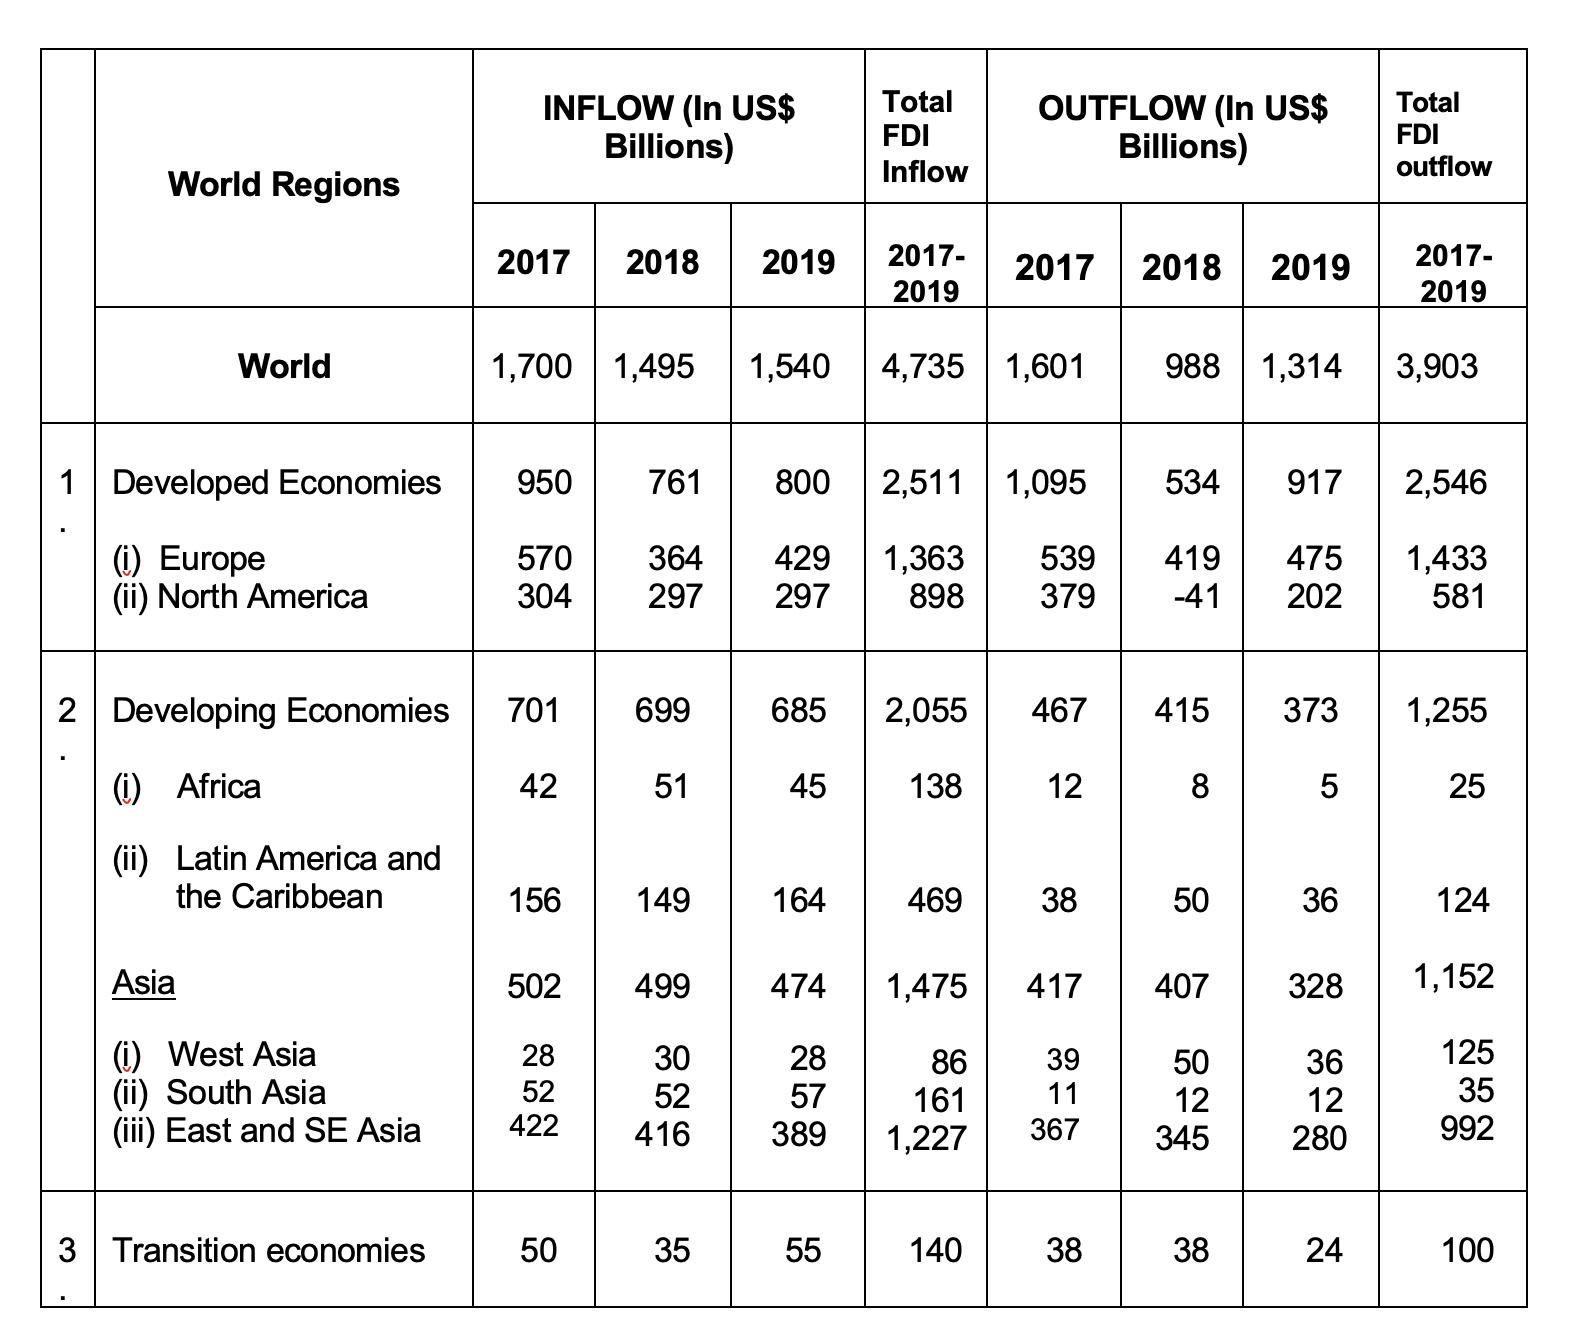
2017-2019: Table 3 shows that the developed economies received a total of FDI 2,511 billion US dollars in the period 2017-2019, while the developing economies received total of 2,055 US dollars in FDI, that is, 82% of the investment made in the developed economies. Of the total FDI that went to the developing economies, that is, 2,055 US billion dollars, Africa received 138 billion US dollars representing 6.7% of this amount, while Asia received 1,475 billion US dollars, representing 72% of this investment amount.
Summary of analysis
This presentation is more interested in FDI net inflow than in FDI net outflow since FDI net outflow is dependent on FDI net inflow. It can be seen however, that the net outflow for the developed economies was higher or slightly higher than the net inflow for each of the three periods indicated in the tables, possibly indicating higher profit earnings and therefore higher outflow of funds for further investment in home countries or in other economies in their region.
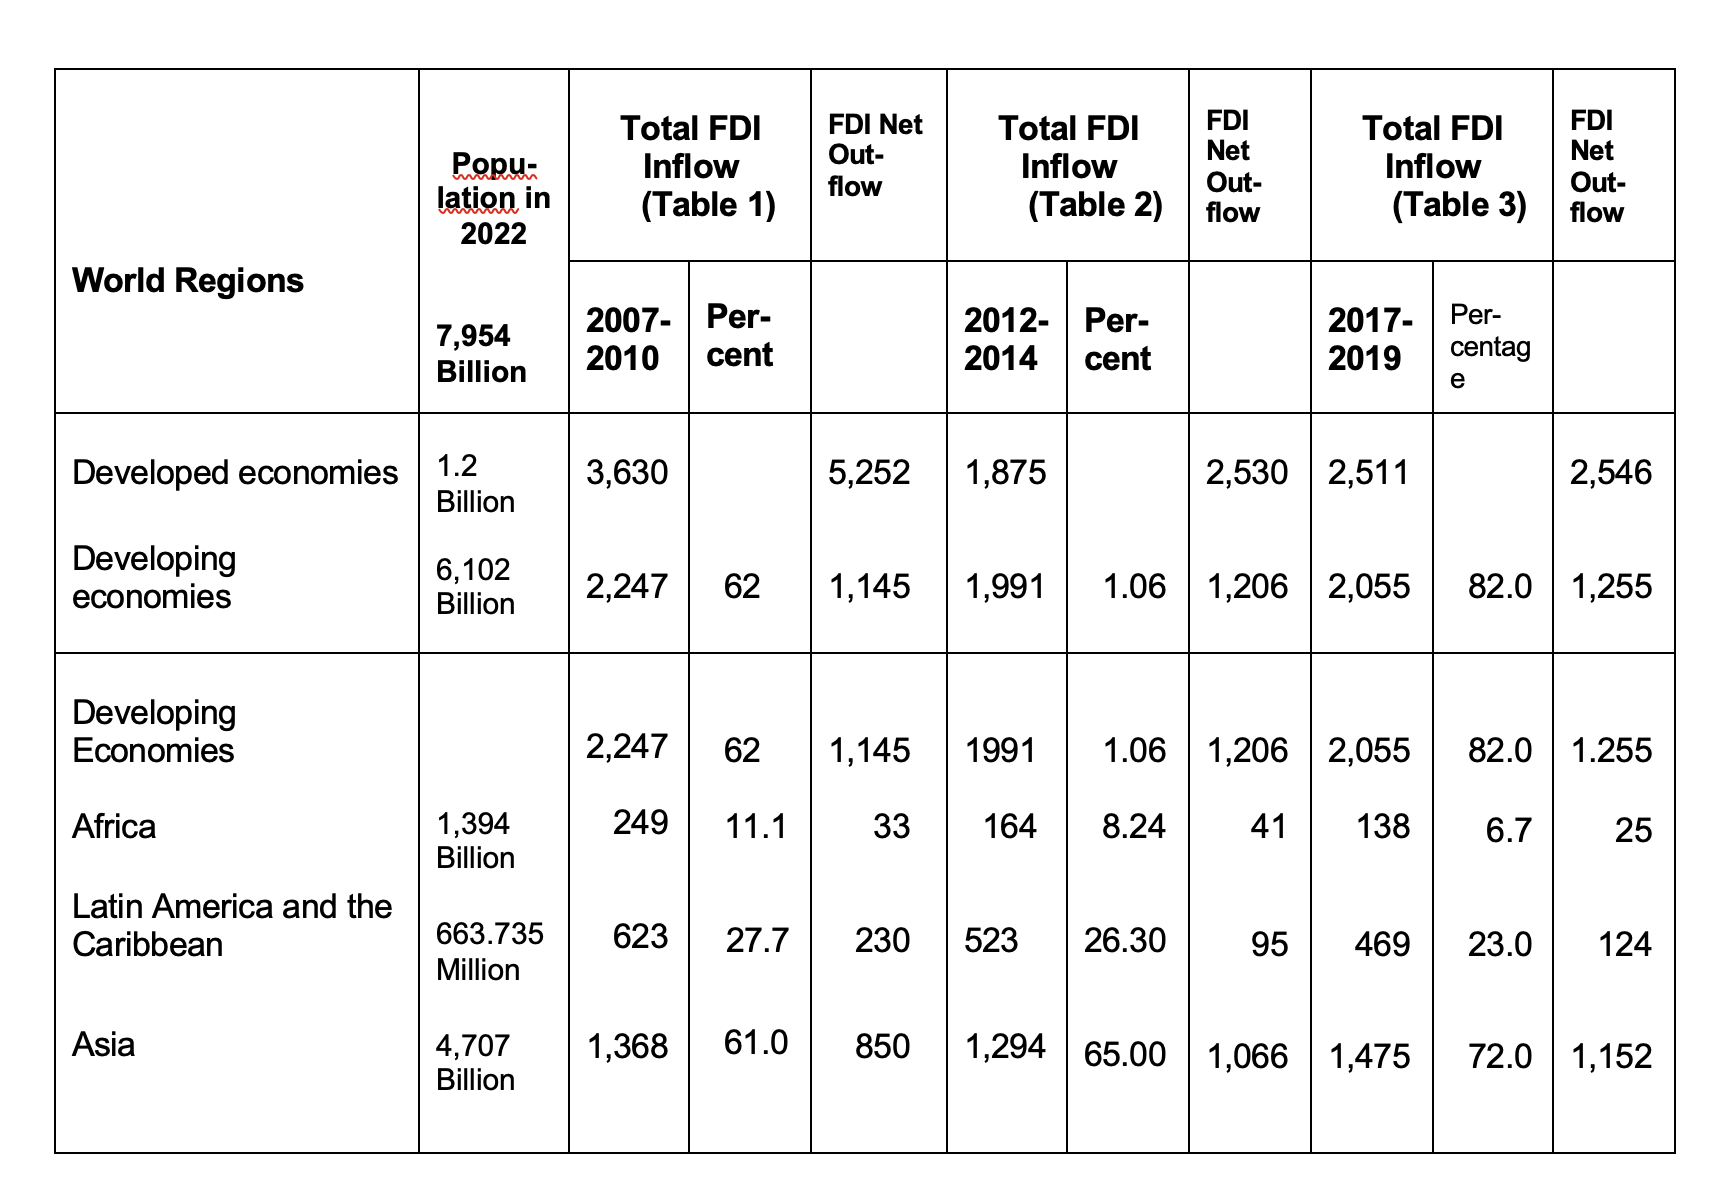
A summary of the analysis of the data in Tables 1-3 is presented in Table 4.
Table 4: Summary of analysisTable 4: Summary of analysisThe percentages are calculated as follows: While the developed economies received an investment amount of US$3,630 billion in the period 2007-2010, the developing economies received US$2,247. This amount represented 62% of the amount received by the developed economies in that period. Out of the total investment amount of US$2,247 received by the developing economies in that period, Africa received 11.1%; Latin America and the Caribbean received 27.7%, and Asia received 61%. The rest of the table is equivalently interpreted.
The analysis shows that FDI to Africa has been decreasing in size over the years: From 11.1% of the total investment to developing countries in the period 2007-2010, to 8.24% in the period 2012-2014, and to 6.7% in the period 2017-2019.
Table 4 shows clearly, that Africa has not been a favourable destination for Foreign Direct Investment. It should be recognized that investment is not charity. The investor requires profit for their investment and will therefore choose a destination or the economy that their investment money could make reasonable profit
The analysis in Tables 1-3 show that East Asia and South-East Asia are the destinations that receive most investment to developing economies.
Why more FDI in East and South East Asia?
It has been indicated in some reports that investors in the developed economies tend to invest more in other developed economies; and that those who choose to invest outside developed economies tend to choose East Asia or South-East Asia. We could consider a couple of factors that make East and South-East Asia more favored destinations for direct investment money.
Work ethic
The work ethic of Asians in East or South East Asia has become proverbial around the world propagated in a number of books written by persons who have visited or worked in that region of the world. Writers have, however, reached the conclusion that every culture, with supreme motivation and determination can develop the high work ethic of East and South East Asians. Can African countries develop this level of work ethic in the next 20 years?
Education
Besides the powerful work ethic of East and South East Asians, the next factor to consider is their high level of education evidenced by their positions in the International Education Achievement (IEA) examination administered every four years to students of ages 13-15 from at least 50 countries around the world. Students from Hong Kong, Taiwan, Singapore and the Republic of Korea generally pick up the 1st to 3rd positions in science and mathematics, making these countries the leaders in the two critical subjects needed for current world development. African countries that used to take part in these examinations have performed so badly they have consequently stopped taking part in these examinations. It is the shame and embarrassment of these countries that has made them stop entering for these examinations. But African countries should rather confront their fears and embarrassment by improving their education systems and preparing harder to enter these examinations to be able to evaluate their preparedness for the intellectual demands of modern industrialization and development processes.
Quality of production
Higher knowledge and skill are two combined factors that are needed in modern-day inventions and production. The quality of production improves at much faster pace where the work force is
trained at higher levels of education to be prepared for the application and creativity required in modern production. Nations that are lagging behind in this level of education quality are nations that will lag behind much of the world in production, development and in the general quality of life.
Why can’t Africa attract much FDI
Tables 1-4 above have been prepared to show the leadership and citizens of African countries the current state of foreign direct investment direction in the regions of the world today. The general picture indicated in the tables should help the continent’s leadership to consider ways and means for restructuring their economic and political systems in a way that will make Africa a more favoured destination for FDI. Nothing is impossible; but it takes time and effort.
A number of factors work together to make Africa an unfavourable destination for FDI presently. These factors are listed with bullets without explanation:
Political instability.
Consistent military interventions
Low work ethic
Lower than expected education quality
Unbridled Corruption
How Africa can increase local and foreign investments
Improve the quality if education on the continent beginning from primary to tertiary levels.
Instill the value of high work ethic for personal life and for business production.
Consider aspects of the cultures of the continent that lead to wasteful use of time.
Make production of high-value products a high priority.
Encourage Africans with the means to invest more in their countries.
Improve the banking and financial systems.
Put more emphasis on export production.
Develop effective business climate consisting of structures and incentives for both local and foreign businesses operating in their countries.
Take measures to put effective control of the economies of the continent in the hands of organised and responsive private sector business rather than leaving the economies largely in the hands of foreign manufacturing and exporting companies operating in cooperation with local importers.
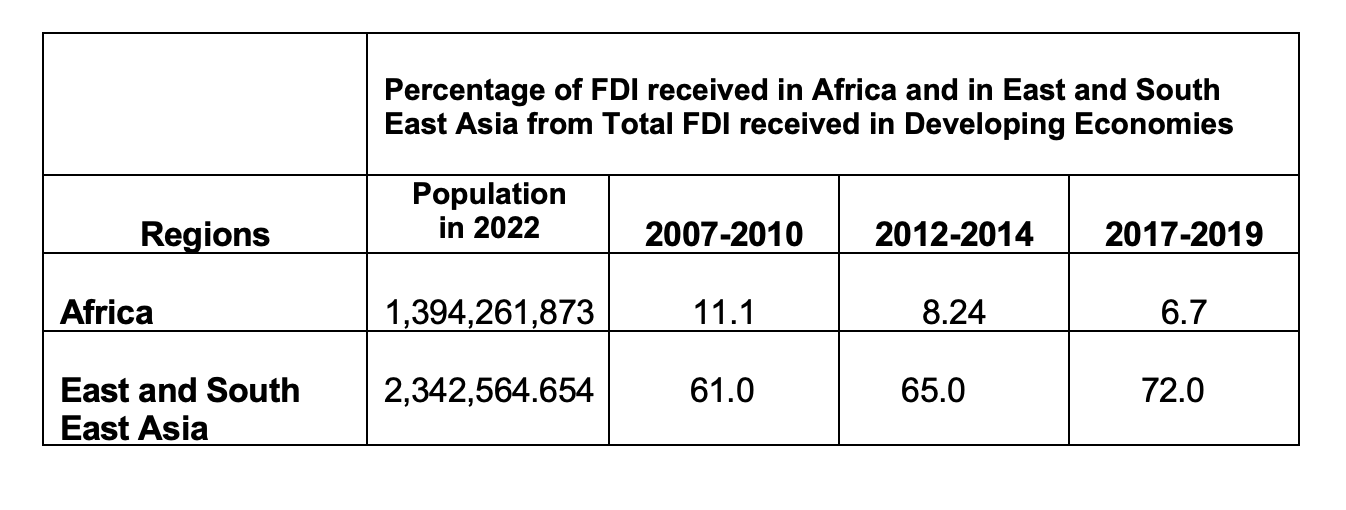
As indicated in Table4, the value of FDI net inflow to Africa has been declining while it is increasing rapidly in East and South East Asia as also shown in Table 5 below:
Table 5:Percentage of FDI received in Africa and in East and South AsiaTable 5: Percentage of FDI received in Africa and in East and South AsiaThe above table is not intended to urge competition. East Asia consists of China, Japan, Hong Kong, North Korea, South Korea, Taiwan, Macau and Mongolia. The region is made up of the power houses of modern industry. And South East Asia consists of Singapore, Malaysia, Indonesia, The Philippines, Thailand, Mynmar and five other countries, all well organised countries, and highly skilled in industry and finance. Investors in these regions invest in businesses in within their regions and in business in the Developed Economies.
The table is presented to serve as a lesson to those of us in Africa. Money has no colour. It goes to regions and countries that are knowledgeable, skillful, ready and prepared to put it into profitable use; not to countries that are still steeped in old traditions, and in old colonial economic pursuits with uncertain political future. Until our political leaders create favourable political and business climate, help to move African economies to modern production of high-value industrial goods and services, the value of FDI coming to Africa, even from Africans living overseas, will continue to decline, probably reaching less than 2% by 2030.